Today we look at AC,RC and LRC circuits and we
will analyze how resistors, capacitors, and inductors when arranged together
affect the current and voltage relationships.
AC RC CircuitsToday, we learned about AC and RC circuits at the beginning,
In AC circuits, resistors, capacitors and inducotrs create resistance within the circuit. Ohm's Law states V = IR, but in an AC circuit, the total resistance is called impedance, Z. And we know that the total resistance within the circuit the total impedance is Z. The equation for the total impedance is Z=square root(R^2+(X_c)^2). Xc equaling 1/wC.
Then we did an experiment to mearsure V_rms, I_rms and get Z to compare with Z_Theoretical.
In this photo, We use Vernier Logger Pro Voltage probe current probe dual channel amplifier and function generator and RLC circuit board , then we use some wires to connect them.
Next, in this photo, we use logger pro to find the graphs of V and I, and we also get the V_max and I_max from the graphs. For this experiment, we set up the function generator at 10Hz and then we looked at the graph using logger pro for the same experiment with 1000 Hz and found a relationship between frequency and current. This was all connected to Logger Pro in order to read current and voltage over time. Before gathering readings, we calculated the theoretical impedance that we'd expect from this circuit, which was placed into the table of data shown below. We took readings and used that data to fill in the rest of the table shown below. What observe is that impedance greatly decreases when frequency is increased.
In this photo, we made a form and at the left of the bottom, we use the data the profosser gives us and use the equation Z=square root(R^2+(X_c)^2). to find the Theoretical Z. When f=10Hz, Z=159.3; when f=1000Hz, Z=10.13.We measured the current and voltage seen in the picture and found that the current graph had many bumps which was due to the sampling rate at high frequencies. After adjusting the sampling rate, we fit the graph and used the values for our calculations of theoretical/experimental values.
But when we want to find the graphs of 1000Hz, there is some question, we can not use the logger pro to make the right graphs when we want to measure the I and V at the same time. So we have to measure V and I seperatly.
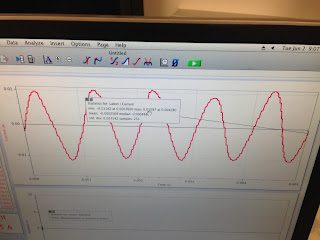
In this photo, it shows the graph of current.
and we measure that the V-max =0.9841; when we find the I_max, we use the min+max/2 of the graph to find that I-max=0.01135A.
In this photo, we ues the theoretical data to find the angle when the frenqucy is 10 Hz and 100Hz and we use the equation tan^(-1)(X_c/R)
Then we use the equation Z^2=R^2+X^2 to find the experiement data of the angles and we find they almost same.
Resonance in RLC Circuits
Then we start to learn the RLC circuits. With an RLC circuit by connecting a resistor, inductor, and a capacitor to the circuit. The results in the white board on the right shows the results of experiment using the circuit board and multimeter to compare to theoretical calculations
In this photo, we use the equation f=1/2pi*square root(CL) to find the frenqucy is 5033 Hz.
Then when we change the frenqucy to 3000Hz, we use the equation I_rms=V_rms/Z to find that the I_rms=2.06A.
Then the Power in this circuit is P=I^2R=42.4 W.
Then we did another experiment about RLC circuit. We use the same RLC circuit board some wires to connect. and use multimeter to measure the voltage and current of the circuit. In fact in an RLC
circuit, we find resonance when the capacitive inductance of the inductor is
equal to the capacitive reactance of resistor. We get that W=1/sq(LC) which
occur only in correlation to maximum power.
The experiment was repeated with an RLC circuit by connecting a resistor, inductor, and a capacitor to the circuit. The results in the white board on the right shows the results of experiment using the circuit board and multimeter to compare to theoretical calculations.Then we find the Z_exp =15.5
Conclusion:
Today in class, we looked at different types of
circuits in alternating current. We focused on analyzing resonance and
impedance of AC and LCR circuits, which is different from DC circuits. We found
resistors and capacitors (RC circuit) connected in series that the current and
voltage is different by a phase angle. And we know how impedance and resonance
is affected. At RLC circuit, we found that there was a special case of
resonance where the angular frequency is inversely proportional to the inductor
and capacitor.


No comments:
Post a Comment