Friday, June 5, 2015

6/2 week 15 day 1 RLC and RC graphs and circuits

Purpose:
Today we  look at AC,RC and LRC circuits and we will analyze how resistors, capacitors, and inductors when arranged together affect the current and voltage relationships.
AC RC Circuits
Today, we learned about AC and RC circuits at the beginning,
In AC circuits, resistors, capacitors and inducotrs create resistance within the circuit. Ohm's Law states V = IR, but in an AC circuit, the total resistance is called impedance, Z.  And we know that the total resistance within the circuit the total impedance is Z. The equation for the total impedance is Z=square root(R^2+(X_c)^2). Xc equaling 1/wC.
In this photo, we use this equation and we already know that X_c=1/(2pi*f*C) and Z=V_rms/I_rms, we get that I_rms=V_max/square root (2*(R^2+1/4w^2*C^2))
 Then we did an experiment to mearsure V_rms, I_rms and get Z to compare with Z_Theoretical.
In this photo, We use Vernier Logger Pro Voltage probe current probe dual channel amplifier and function generator and RLC circuit board , then we use some wires to connect them. 
Next, in this photo, we use logger pro to find the graphs of V and I, and we also get the V_max and I_max from the graphs. For this experiment,  we set up the function generator at 10Hz and then we looked at the graph using logger pro for the same experiment with 1000 Hz and found a relationship between frequency and current. This was all connected to Logger Pro in order to read current and voltage over time. Before gathering readings, we calculated the theoretical impedance that we'd expect from this circuit, which was placed into the table of data shown below. We  took readings and used that data to fill in the rest of the table shown below. What observe is that impedance greatly decreases when frequency is increased.


In this photo, we made a form and at the left of the bottom, we use the data the profosser gives us  and use the equation Z=square root(R^2+(X_c)^2).  to find the Theoretical Z. When f=10Hz, Z=159.3; when f=1000Hz, Z=10.13.We measured the current and voltage seen in the picture and found that the current graph had many bumps which was due to the sampling rate at high frequencies. After adjusting the sampling rate, we fit the graph and used the values for our calculations of theoretical/experimental values.
And at the right, we use the data we find in the graph and find that when f=10 Hz, the Z=172.07 and we get the error is 8%.
But when we want to find the graphs of 1000Hz, there is some question, we can not use the logger pro to make the right graphs when we want to measure the I and V at the same time. So we have to measure V and I seperatly. 
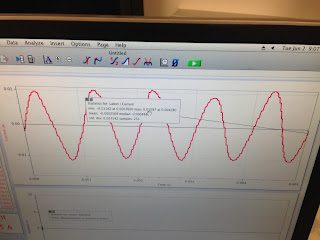
In this photo, it shows the graph of current.
and we measure that the V-max =0.9841; when we find the I_max, we use the min+max/2 of the graph to find that I-max=0.01135A.


In this photo, we ues the theoretical data to find the angle when the frenqucy is 10 Hz and 100Hz and we use the equation tan^(-1)(X_c/R) 

Then we use the equation Z^2=R^2+X^2 to find the experiement data of the angles and we find they almost same.


Resonance in RLC Circuits


Then we start to learn the RLC circuits. With an RLC circuit by connecting a resistor, inductor, and a capacitor to the circuit. The results in the white board on the right shows the results of experiment using the circuit board and multimeter to compare to theoretical calculations
In this photo, we use the equation f=1/2pi*square root(CL) to find the frenqucy is 5033 Hz.
Then when we change the frenqucy to 3000Hz, we use the equation I_rms=V_rms/Z to find that the I_rms=2.06A.
Then the Power in this circuit is P=I^2R=42.4 W.
Then we did another experiment about RLC circuit. We use the same RLC circuit board some wires to connect. and use multimeter to measure the voltage and current of the circuit. In fact in an RLC circuit, we find resonance when the capacitive inductance of the inductor is equal to the capacitive reactance of resistor. We get that W=1/sq(LC) which occur only in correlation to maximum power.


The experiment was repeated with an RLC circuit by connecting a resistor, inductor, and a capacitor to the circuit. The results in the white board on the right shows the results of experiment using the circuit board and multimeter to compare to theoretical calculations.Then we find the Z_exp =15.5

Conclusion:
Today in class, we looked at different types of circuits in alternating current. We focused on analyzing resonance and impedance of AC and LCR circuits, which is different from DC circuits. We found resistors and capacitors (RC circuit) connected in series that the current and voltage is different by a phase angle. And we know how impedance and resonance is affected. At RLC circuit, we found that there was a special case of resonance where the angular frequency is inversely proportional to the inductor and capacitor. 

5/28 week 14 day 2 Resistors, Capacitors, and Inductors in an AC Circuit

Alternating Currents and Voltages
At the beginning of the class, the professor shows us the graphs of alternating currents and voltgaes. They are both Formulas of trigonometric functions. And we know that the relationship between V_max and V_rms, I_max and I_rms are V_max=square root 2 *V_rms, and I_max= square root 2*I_rms.
In this photo, there are the relationships between  V_max and V_rms, I_max and I_rms. We look at the oscillating voltage of an AC power supply. We calculated the Vrms in relationship to Vmax in the calculations using integration shown in the photo
Then we did an example which is at the bottom of this photo.
Then we use a circuit board we preformed three experiments using an AC power supply across a resistor, capacitor, and inductor where we used logger pro to analyze the current and voltage.We have that V_rms=120V and find that V_max is 170V and the perk to perk is 340V.
Then we did an experiment about alternating currents and voltages. We use vernier logger pro current probes dual channel amplifiers, function generator, resistor using the RLC circuit board and a digital multimeter and sevearl wires.
In this photo, we connect all the equipment and use the logger pro to find the graph of alternating current and voltage.
There is the graphs of alternating current and voltage. The red one is current and the blue one is voltage. The graph shows that as voltage increases, current also increases as seen in our sinusoidal graph and fit. Most importantly, the graph shows that the voltage and current is in phase with each other.

We set up the resistor is 100 omh and voltage is 2V, and use the graph to find the V_max and I _max and use the equation V_max=square root 2 *V_rms, and I_max= square root 2*I_rms. to find the V_rms and I_rms.  and use 2V and 100omh to find the theoretical V_rms and I_rms and find the error of them.

Capaitors in a AC Circuit
We know the equaition of V=V_max*sin(wt+theta) and we use this equaiton to find the equation of I and we find that the aptitude of I is bigger than V,.We derived another set of equations with capacitance and found that there is a phase shift. Since we know that the angular frequency is 2pif. 
In this photo, the professor gives us that C=0.02uF and f=10kHz and V_rms=50V . We can calculate the capacative reactance with the given frequency and capacitance then apply ohms law to find the Irms using the Vrms value.we know that the equation about X=1/wC and w=2pi*f so we get that X=796 and I_rms=V_rms/X and we get I_rms=0.063A
Then we diid an experiment about Capacitors in an AC circuit.
We use a vernier Logger pro voleage probe current probe dual channel amplifier, one function generator and RLC circuit boad to do this. we set up for frequency=100Hz, the indicated is 100uF, and the voltage is 2V.

Then we connect the equipments and use logger pro to find the graph of I and V. Then accodring to graphs, we find the V_max=2.005 V and I_max= 0.116A The graph shows the current and voltage with an capacitor with results indicating that the voltage graph is lagging by 90 degrees meaning that they are out of phase. This is consistent with our derivations. When there is a large voltage across a capacitor, that means the capacitor is fully charged Q=CV. 

Then we filled the form in these two graphs by using the same way to do the experiment of Alternating currents and voltages.When Q is max, we get that the capacitor will impede the flow of charge. Therefore the current will be zero when voltage is at maximum and minimum seen in the graph. When the voltage goes negative, it will induce a current causing the current to be at a maximum. and we get that I_rms=0.0731A,V_rms=1.42V and the theoretical capacitive reactance is 15.9. and the experimental capacitive reactance is 19.4 so the percent error is 18%.
In this photo, in order to make sure we did right, so we use the equations to find the I_rms is 0.089  is almost like the I_rms we find by using data from the graph.

Inductors in Alternating Circuits
In this photo, according the equation V=V_max*sin(wt+theta), use the intergel to find that I=-V_max/wL*cos(wt+theta)
The professor give us that V=0.5V, L=0.5uH, f=100Hz and we use the equation X_L=wL to find that X_L=3.14*10^(-4) and I_rm=1126A, which is very large.
Then we begin to do the experiment about inductors in alternating circuits.
we use the same equipments but just change capacitor to inductor.

we use a N=110 inductor to find the L=uN^2A/l= 7.6*10^(-8) and find that X_L=wL=0.48.

Then we use logger pro to make this graph in the photo, and do the same thing like find the V_rms, V_max, I_rms and I_max.The results showed an interesting elliptical shape for the current vs voltage graph and this is consistent as the phase shift is under 90 degrees in comparison to the capacitor
we use the datas we find to fill this form. We summarized the results of inductors in AC circuits and we found that we ran a current through using a function generator, collected data, calculated expected values for I(rms) and V(rms) using our data, and then took actual readings using a multimeter. Our values (seen below) are slightly better in regards to the percent error, but the error is still rather high.

Conclusion:
Today in class, we created three circuits which consisted of a function generator and one of preformed three experiments, which were a resistor, capacitor, and inductor. We learned a lot on thursday about RL and RC circuits and the graphs that are generated from the RL and RC circuits. By relating Vmax and Imax values, we can find our Vrms and Irms in order to analyze our results. We saw how the phase shift affects the graphs and calculated it to be t(time)/T(Period)

5/26 week 14 day 1 RL circuits and Induction Lab with Oscilloscope

Introduction to inductance
At the beginning of the class, we know that any change in the current through an inductor leads to a change in the magnetic field it produces. This is turn leads to a change in the magnetic flux through the inductor which, by Faraday's law, produces an induced emf in the inductor.
We used the equation for inductance using a given resistance and found that the inductor had an inductance of 760 mH. we found the resistance of the copper wire in the given inductor based on calculations below after find the inductance of the given inductor.. Number of coils is 110, length of 0.05m, radius of 5.12 * 10^-4m. First, we calculate the area of the 18 gauge copper coil using the area of circle formula. We know the density of copper to be 1.72 * 10^-8. By plugging in the numbers for density multiplied by length per area, we can find the resistance to be 0.3 ohm


In this photo, we draw the graph of Current and time according to Voltage vs time graph in the first photo. As the time goes by, the Voltage of inductor decreases and the current increases.
In this photo, the professor gives us a 100 ome resistor and let us measure its resistor according to the color chart. and we know that  the brown is 1, black is 0 * brown is 10 so the resistor is 100.
Then we calculate the inductor according the equation L=u*N^2*A/l. and we have that the area of the inductor is 25cm^2 and the resistor is 100ome and the N is 110 so we get that L=760mH
Then we calculate the resistor of the copper wire in the inductor according to the equation R=pL/A and we find that the R is 0.463, which is very samll.
Then we calculate the time constant of the LR circuit by T=L/R and we get that is 5.1*10^-6 s
In this photo, the professor gives us the period is T=5t=2.55*10^-5 s

Experiments and Analysis
we start to do the experiments about the oscilloscope.


First,we set up the oscilloscppe like in this photo. Here was the set up before we tried to solve for the period and then the time constants and then the number of loops our inductor had.  We had to change the set up of the graph just to solve for those three things.
Then we connect the Function generator , a resistor and the inductor in a circle. we find that the graph in the oscilloscope is changed.
Then in this photo, we begin to measure the inductance using the equipment in the last photo and compare it with the calculation one.  First, according to calculation, we know that a N=110 inductor's inductance is 760mH. Then we first find the T_1/2 IS 3.4*10^-6s and use the equation t=t_1/2/ln2 to find the time constant is 4.9*10^-6. and then according to time constant=L/R we find that L is =736mH
 Then we did a lR Circuit Problem in this photo.

A. we know the inductance is 35mH and use the equaiton time constant=L/R to  the time constant is 290us.
B. we know that the inductor and a resistor is parrel with another resistor so we use the equation I=V/R to fin the I_1=0.062A and ues I=I(1-e^(t/L/R)) to find the I_2 =0.17A
C. in this question, we use the equation V=IR to find the change of voltage after 170us.
D. we know that the voltage of inductor is 11V so we know that the voltage of resistor is 34V and we get the current is 0.28A. Then accodring the equation I=I(1-e^(t/L/R)) we find that after 402us the voltage of inductor is 11V
F. according the equation E=1/2LI^2 and we find the energy in the inductor is 480uJ.

Conclusion:
Today in class, we looked more in depth into inductors and put one to the test by using it in a circuit, from which we measured various experimental values to compare against our theoretical ones. we know that any change in the current through an inductor leads to a change in the magnetic field it produces. When an inductor is added to the circuit and the current is seen to increase rapidly and reaches a steady state as seen in the experiments of our oscilloscope and RL Circuit problems.